AUDL Historical Team Rankings
The First Decade: 2012-2021
9Ware's AUDL Net Statistical Power Index (Net SPI)
rankings are based on our proprietary mathematical analysis of the results
from all 1284 games played during the the first decade of the American Ultimate Disc League.
See The Math |
AUDL Website |
AUDL Wiki
| AUDL Team Net SPI Rankings [2012-2021] | |||||
|---|---|---|---|---|---|
| # | Team | Div | Team SPI | Div SPI | Net SPI |
| 1 | Toronto Rush | East | 79.17 | 59.11 | 81.00 |
| 2 | Dallas Legion | South | 73.25 | 53.05 | 73.86 |
| 3 | Carolina Flyers | South | 69.49 | 53.05 | 70.10 |
| 4 | Madison Radicals | Cent | 73.42 | 29.39 | 69.30 |
| 5 | SF Flamethrowers | West | 67.09 | 45.98 | 66.28 |
| 6 | NY Empire | East | 58.42 | 59.11 | 60.25 |
| 7 | Oakland Spiders | West | 59.12 | 45.98 | 58.31 |
| 8 | Atlanta Hustle | South | 57.34 | 53.05 | 57.96 |
| 9 | LA Aviators | West | 57.69 | 45.98 | 56.88 |
| 10 | DC Breeze | East | 54.44 | 59.11 | 56.26 |
| 11 | Seattle Cascades | West | 53.25 | 45.98 | 52.45 |
| 12 | Indianapolis Alleycats | Cent | 56.38 | 29.39 | 52.26 |
| 13 | Minnesota Windchill | Cent | 55.30 | 29.39 | 51.18 |
| 14 | Pittsburgh Thunderbirds | Cent | 55.25 | 29.39 | 51.13 |
| 15 | Chicago Union | Cent | 53.50 | 29.39 | 49.38 |
| 16 | Austin Sol | South | 48.20 | 53.05 | 48.81 |
| 17 | San Diego Growlers | West | 49.61 | 45.98 | 48.81 |
| 18 | Vancouver Riptide | West | 48.57 | 45.98 | 47.77 |
| 19 | Tampa Bay Cannons | South | 44.49 | 53.05 | 45.10 |
| 20 | Ottawa Outlaws | East | 42.97 | 59.11 | 44.80 |
| 21 | Montréal Royal | East | 42.80 | 59.11 | 44.63 |
| 22 | Philadelphia Phoenix | East | 22.92 | 59.11 | 24.75 |
| 23 | Nashville Nightwatch | South | 22.60 | 53.05 | 23.21 |
| 24 | Cincinnati Revolution | Cent | 20.22 | 29.39 | 16.10 |
| 25 | Rochester Dragons | East | 13.47 | 59.11 | 15.29 |
| 26 | Detroit Mechanix | Cent | 9.42 | 29.39 | 5.30 |
|
Teams not included (fewer than 50 games played through 2021)
Current Teams: Boston Glory, Colorado Summit, Portland Nitro, Salt Lake Shred Past Teams: Charlotte Express, Columbus Cranes, Connecticut Constitution, NJ Hammerheads, Philadelphia Spinners, Rhode Island Rampage, Salt Lake City Lions |
|||||
How We Did It
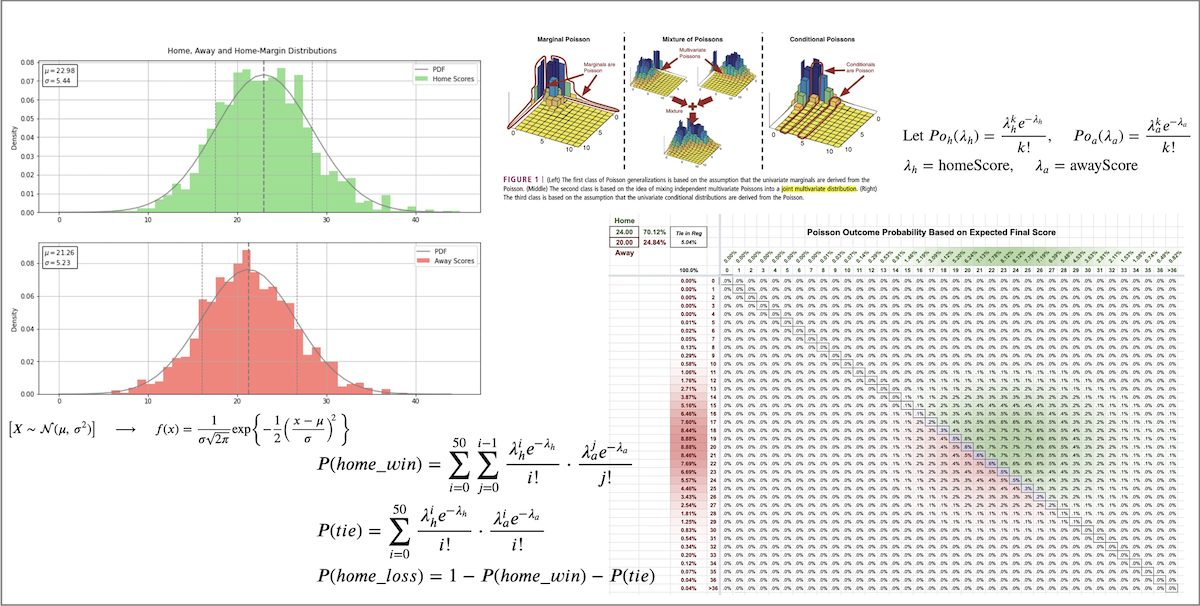
Short Answer: We used a combination of the Monte Carlo method and Poisson Distribution analysis to simulate results from 5000 home and 5000 away games for each of the 26 AUDL teams against "Statistical Average" AUDL away and home teams, respectively. For each of these 260,000 simulations we used final scores sampled from normal distributions of the chosen and average teams to fill a 50x50 bivariate Poisson grid of all possible final scores based on a scoring rate of each of those scores over a 48-minute (regulation non-overtime) game. The calculated probabilities in each cell of the grid were then compiled to determine the overall probability of a win, loss or tie by the chosen team in each simulation. Games were weighted equally regardless of season, with all postseason games counting double.
Long Answer: Click here for all the details ↓